
The power of saying no (and having skin in the game)
This article was published on Livewire Markets, 5 April 2022
If there’s one thing you can say about me and my business partner James Dougherty at Lennox Capital Partners it’s that we are unabashed Australian small-cap fundamental equity investors.
I can add to that we are genuine long-term investors who evaluate companies on what they will be worth in three years’ time. And we are a high conviction fund (we hold about 30 stocks we believe will outperform the market and which satisfy our ESG criteria) meaning we say no far more often than we say yes.
Getting to a point where we have high conviction demands we take a rigorous research-based investment approach based on fundamental analysis and in-depth research. We are laser-focused on identifying sustainable businesses that have strong management teams, forecastable and real earnings and favourable, growth prospects due to competitive advantages and/or industry dynamics.
In this wire, and in the video below, I’ll take you through our investment process and illustrate how we have used ESG screening criteria to help us identify outperformers and steer away from underperformers over time, as well as touching on some stock examples.
Edited Transcript
Hello, I’m Liam Donohue from Lennox Capital Partners. We are an active equity investment boutique that was established a bit over five years ago now.
My business partner and I are unabashed Australian small-cap fundamental equity investors. And there are a couple of points to note for Lennox Capital Partners.
The first is that we are genuine long-term investors. We value businesses based on what we think they’re worth in three years’ time or more. And that allows us to look through short term noise and focus on that longer-term investment horizon.
Secondly, we are conviction investors. We typically only hold around 30 stocks in our portfolio, so that means we say no to more stocks than we say yes to.
And there is a strict criteria that we use to filter out stocks within our portfolios. That does include a strong ESG presence, which I’ll touch on in a bit more detail later.
And lastly, we feel as though by being heavily co-invested into our strategies, we are as aligned as we can be with our clients. Lennox staff aren’t permitted to trade the ASX. So the only way we can get exposure to the market is by investing into our funds.
Now, the chart on this slide really is a summary of how we think about the Australian small-cap marketplace. And importantly, how it differs from the broader Australian share market.
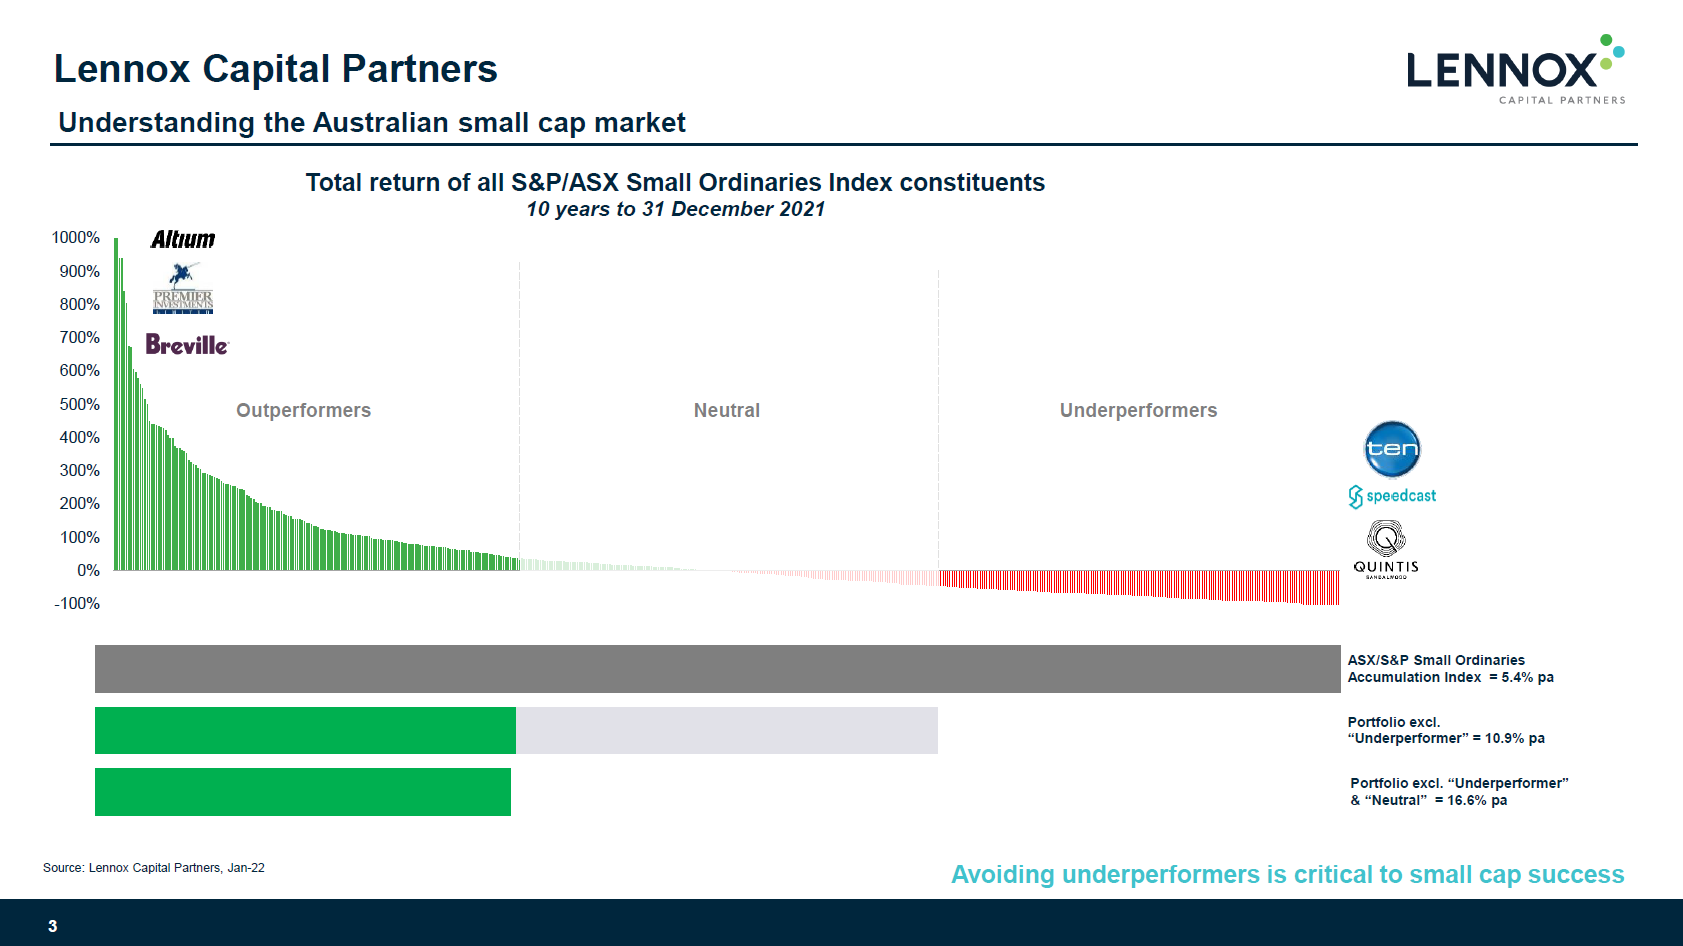
So if we look at the chart on the top of this slide, what that includes is every stock that has formed part of the small ordinary benchmark over the past 10 years. And there’s a bit over 500 stocks within that distribution.
We’ve bracketed those stocks into three equal segments, being the outperformers, the neutrals, and the underperformers.
And the first thing that really stands out on that chart is that the outperforming stocks have performed phenomenally well over that period with some really strong returns amongst the likes of Altium, Premier, Breville, and others included in that basket.
And they’re the stocks that you really hear about when you’d talk about Australian small caps. The big earners, the big returners, the ten-baggers. The businesses that have gone on to become household names, but equally as important to us are the stocks at the other end of that chart, being the stocks in the underperforming segment.
Now, while the quantum of that end of the chart doesn’t look as impressive as the outperformers, it’s interesting to note that almost 10% of the stocks in this distribution have lost 90% or more of their value over that 10 year period.
And what that translates to is when we look at the data in the bottom half of this slide, the thick grey bar represents the small ordinary return over that 10 year period.
And that shows an average return of about 5.5% per annum.
Now, if we do a bit of numerical gymnastics and start removing some of those segments, and we take out the underperforming stocks over that 10 year period, you can see that returns almost doubled, adding about 5% per anum to up near 11% per anum. If we go one step further and remove the neutral segment, we can see that again, there’s about a 5% increment to our average annual return up towards 16.5% per anum.
And the interesting point is that while everyone tries to target as many of those outperformers as they can. And that is obviously part of portfolio construction, to us of equal importance is avoiding stocks in that underperforming segment, because as we saw that incremental 5% per anum to our returns is substantial and is material. And as a result of that, a good part of our investment process is tailored towards not just finding those winners, but equally to avoiding those potentially underperforming stocks.
And the impact that can have on long term returns is substantial. We’ve highlighted here in a chart of our 10 year plus investment track record* that we have been able to outpace the small ordinary benchmark over that period quite substantially.
And we would say a fair amount of that outperformance comes as a result of not just trying to pick those outperforming stocks, but equally on having an investment process that is structured around avoiding and steering away from underperforming stocks that really can drag down that performance.
So if we have a brief look at our investment process, and as I mentioned earlier, ESG is a big part of what we do in terms of our investments and what we’ve done on this slide to highlight the presence of ESG and where that fits into our process is to colour the relevant portion of our process green to highlight ESG. And you can see quite clearly in the first couple of steps, that there is quite a presence of ESG in the first couple of steps of our process.
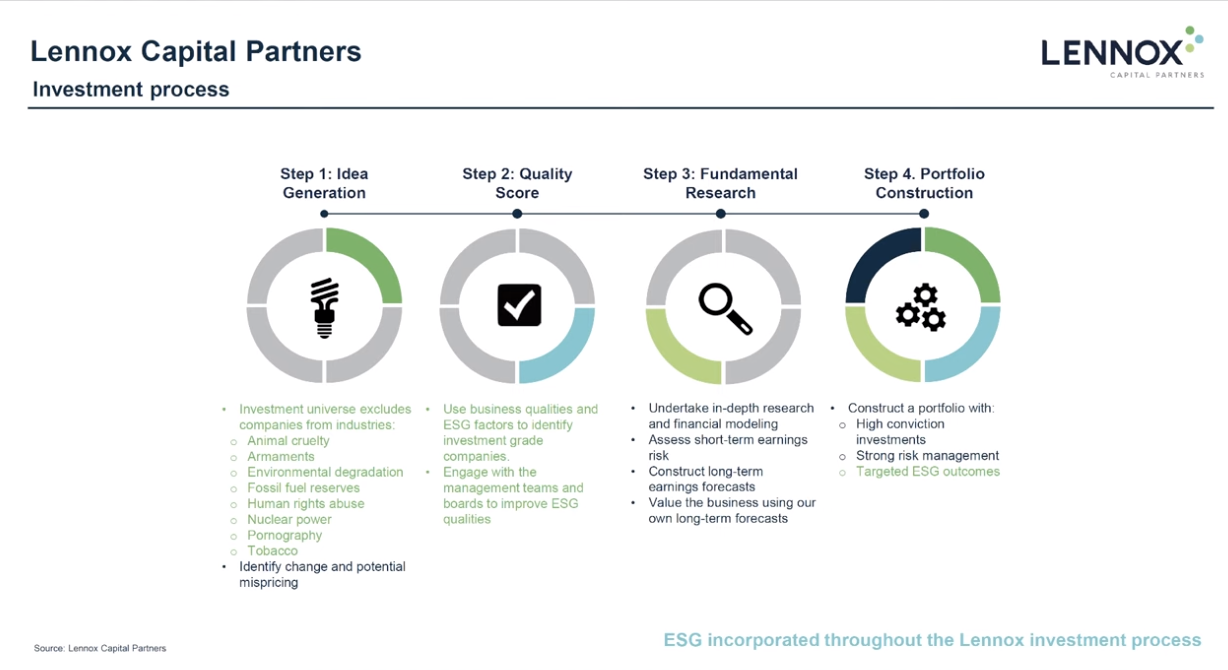
The first being a pure screen, where we screen out certain industries that don’t fit within our ESG remit. And that includes broad areas like armaments and also fossil fuel owners, such as mining and energy companies.
Now, if companies pass through that first filter, the second step of our process is much more engaging where we will actually approach companies, deal with management teams, and understand their ESG positioning and try and get a real feel for their commitment to ESG and compare that to our ESG expectations and ultimately make a decision as to whether or not that company passes through that ESG screen.
Now, from there, a company will move to deep-dive research, which is where we really sink our teeth into a company, engage further with management teams. And we do have 400 of those management meetings a year, and ultimately come up with our own earnings forecast for a business, evaluation for that business, and hopefully a stock that will find its way into our portfolio.
Ultimately, we’ll end up with a conviction concentrated portfolio of our best ideas. And in terms of assessing the impact that process has from an ESG standpoint, which again, I touched on earlier, we’ve recently been able to start incorporating more of that data into our investment process. It’s clear that over recent years, our large-cap peers have moved away from small-cap managers in terms of the data availability from an ESG perspective. But that has definitely started to level up in recent times.
And what we include on this slide is a couple of relevant charts that provide some ESG data for our investment strategy.
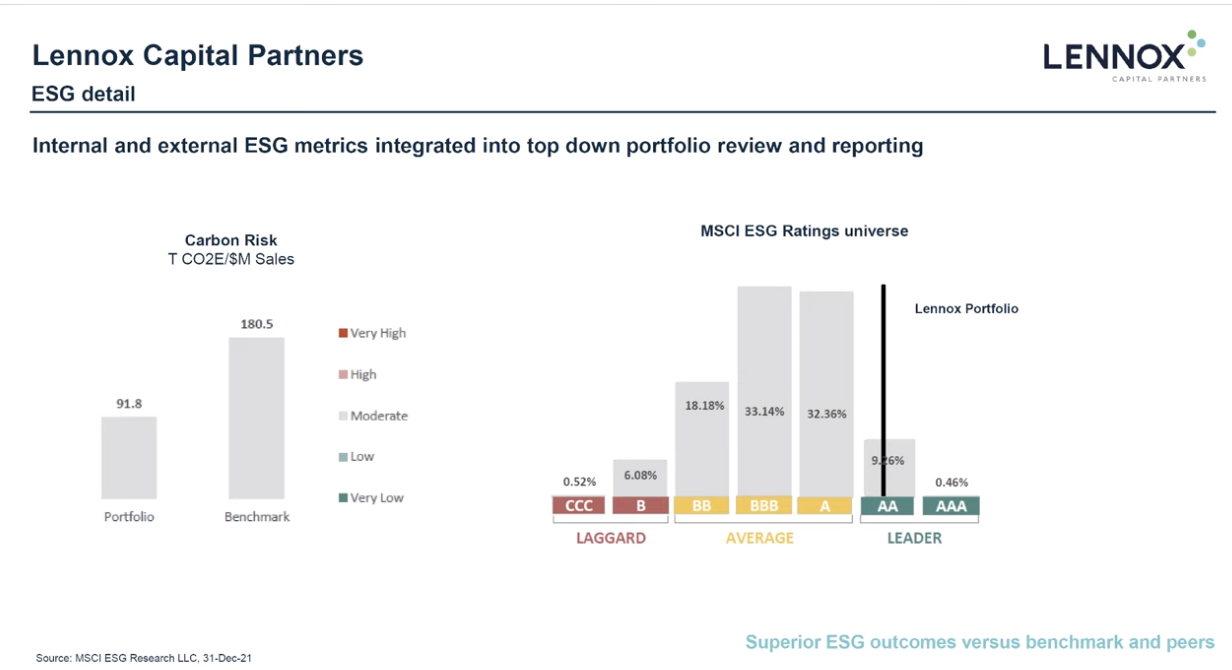
So the chart on the left-hand side here shows carbon emissions on a like for like basis from the Lennox small-cap strategy versus the small ordinaries benchmark. And you can see that we are roughly 50% lower than the benchmark in terms of carbon emissions. So roughly half that of the benchmark. So that’s a very pleasing outcome for us. And that data will obviously move over time, but we have proven to be consistently lower and substantially lower than the benchmark to this point.
Secondly, on the right hand side, we can see where the Lennox small cap investment strategy sits in relation to the MSCI ESG investment universe and this screens all investment strategies within the MSCI universe. And you can see we’ve been awarded a double A rating according to MSCI.
And that puts us in the top 6% or 7% of investment strategies on that ESG analysis. And we are very pleased and proud of that outcome.
Now, moving on to some stocks and we’ve included here a highlight reel of a couple of stocks within our portfolio, you can see fairly diverse names there, a global fashion retailer business in terms of Lovisa, a domestic outdoor media business in terms of oOhMedia, and even a quality mining services company in NRW Holdings.
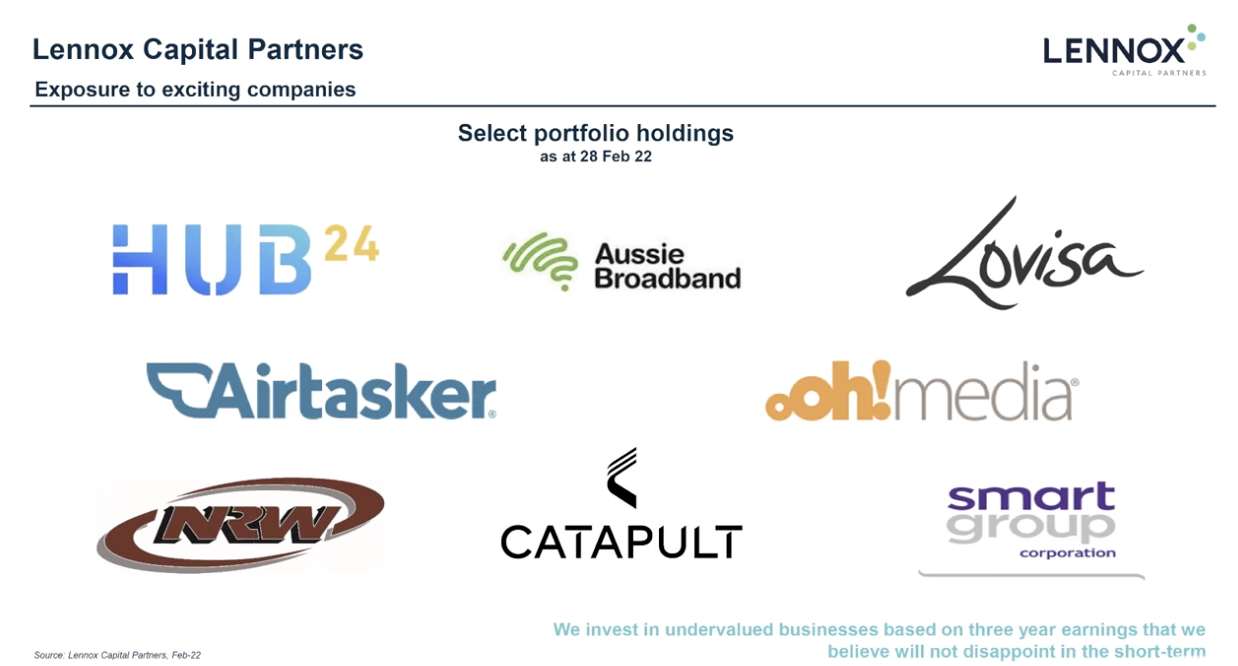
So a relatively diverse bunch of industrial businesses, but one thing that I would say they all have in common is that they all pass through that strict ESG criteria or filter that we have for the businesses that we invest into. And equally, they all have very exciting growth potential and valuation upside ahead of them.
But in order to put one of those stocks into practice in terms of our investment process, I thought we’d touch on Aussie Broadband, being a domestic telco and rapidly growing at that within the NBN space.
Now, Aussie is a business that we invested in as a pre IPO. And typically we’re pretty harsh in terms of our treatment for pre IPOs in that they tend to lock up investor capital for a period of time. And unless there’s super normal returns attached to that, we are relatively reluctant to do that. But in this case, Aussie did pass through that process and has absolutely delivered since that investment was made.
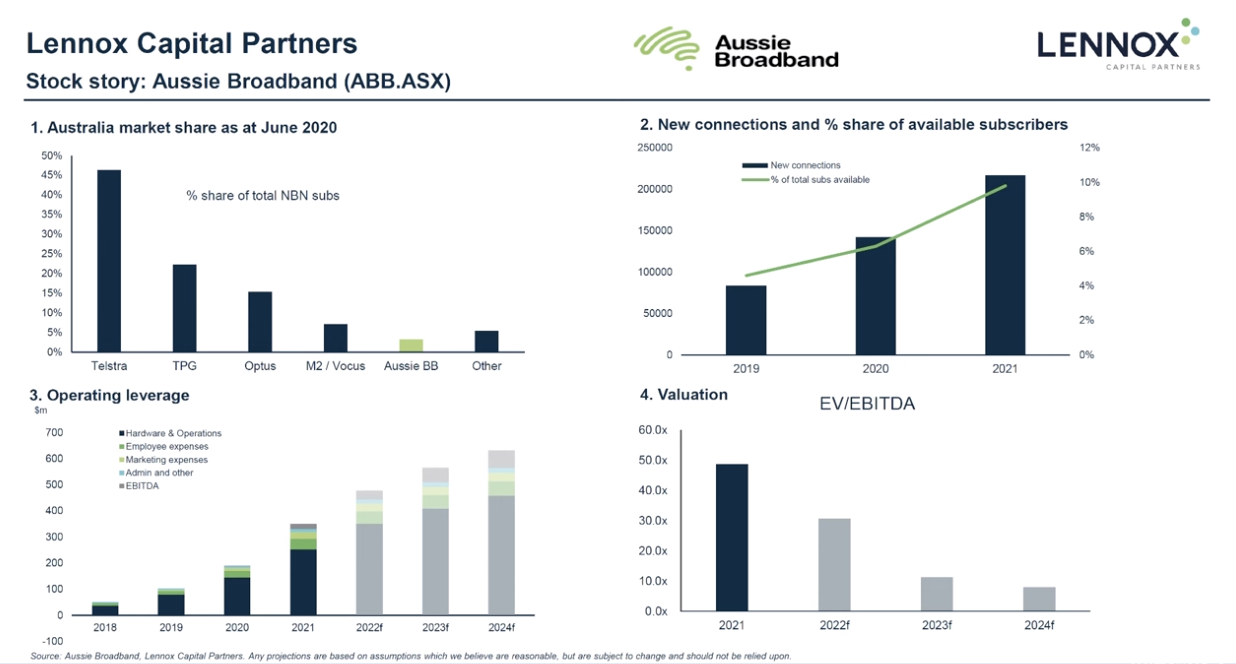
So what we needed out of Aussie Broadband was further growth. And pleasingly in the second chart, we can see that they have delivered on that front. So the blue bar indicates additional subscribers or NBN subscribers being added each year and pleasingly that number does step up each year.
But the green line importantly shows the market share that Aussie Broadband is taking each year. And that was roughly 5% in 2019, improving in 2020, but then up to towards 10% in 2021, and all indications are that market share continues to grow beyond that point – so, very pleasing to see. And the reason that’s important is that within the third chart, you can see the operating leverage that flows through Aussie Broadband as a result of that growth.
In 2019, EBITDA as a earnings metric was broadly zero, but with a relatively fixed cost base, and again, that growth in subscribers, you can see how that earnings leverage has flowed through the business. In FY 24, we’re expecting a bit over $60 million of EBITDA. And depending on certain M&A opportunities in the market at the moment, it may be well north of that number.
So very pleasing to see the leverage.
And then lastly, in the fourth chart, we can see what that translates to in terms of earnings. So on our numbers, which we would consider to be relatively conservative or realistic, a sub 10 times EBITDA valuation metric. And in relation to what we’re seeing in other transactions going through the market at the moment, that is a relatively low multiple.
So it does give us comfort that there is valuation support and substantial valuation upside for Aussie. Then lastly, in terms of our longer term investment strategy performance, you can see our 10 plus year track* record here compared to the small ordinary benchmark.
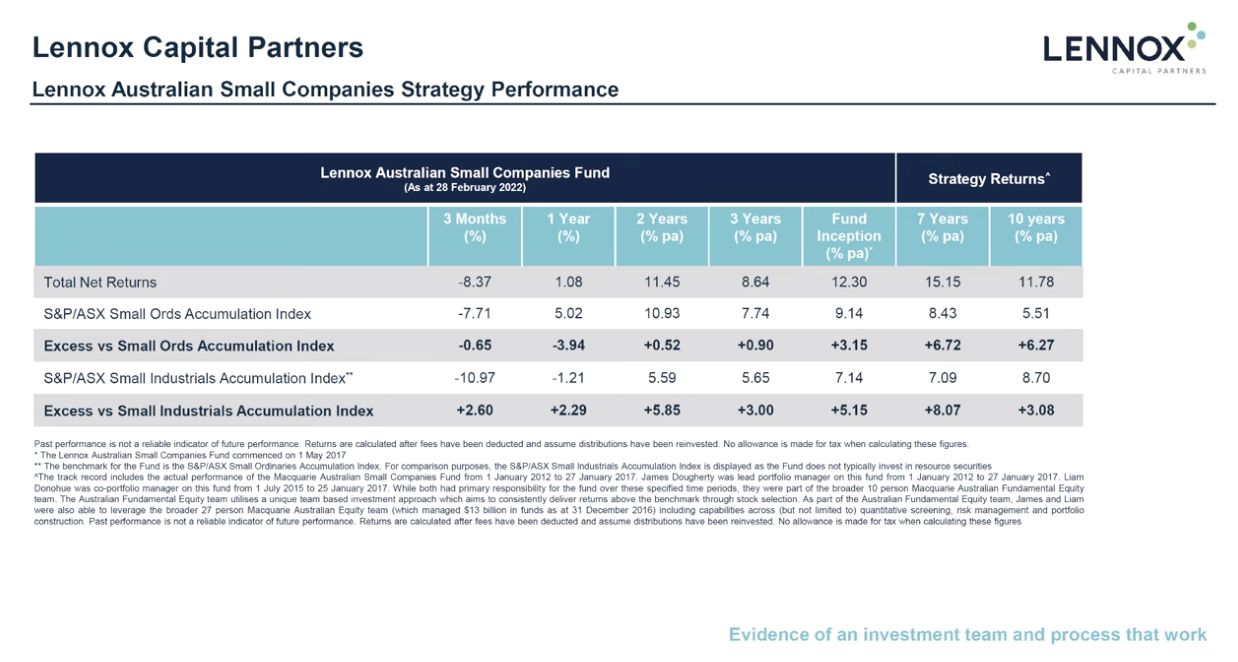
And again, on account of the fact that we screen out certain industries, including energy and mining businesses, there has been a substantial headwind over the past couple of years by not investing in the small resources space.
But pleasingly, when we compare ourselves to the small industrials that is largely exclusive of mining and energy companies, you can see the ability to add reasonable alpha over all time periods against that small industrials benchmark.
So it is pleasing to see that type of screening and ESG analysis does have the potential to add value over the long run. And on that note, thank you very much for your time on behalf of the team at Lennox. And if you do want to get in touch for further information about any of our investment strategies, please use the information on your screen now. Thank you.
This material has been prepared by Lennox Capital Partners Pty Ltd (ABN 19 617 001 966 AFSL 498 737) (Lennox),the investment manager of Lennox Australian Small Companies Fund and Lennox Australian Microcap Fund (The Funds). Fidante Partners Limited ABN 94 002 835 592 AFSL 234668 (Fidante) is a member of the Challenger Limited group of companies (Challenger Group) and is the responsible entity of the Fund(s). Other than information which is identified as sourced from Fidante in relation to the Fund(s), Fidante is not responsible for the information in this material, including any statements of opinion. It is general information only and is not intended to provide you with financial advice or take into account your objectives, financial situation or needs. You should consider, with a financial adviser, whether the information is suitable to your circumstances. The Fund’s Target Market Determination and Product Disclosure Statement (PDS) available at www.fidante.com should be considered before making a decision about whether to buy or hold units in the Fund(s). To the extent permitted by law, no liability is accepted for any loss or damage as a result of any reliance on this information. Past performance is not a reliable indicator of future performance. Any projections are based on assumptions which we believe are reasonable but are subject to change and should not be relied upon. Lennox and Fidante have entered into arrangements in connection with the distribution and administration of financial products to which this material relates. In connection with those arrangements, Lennox and Fidante may receive remuneration or other benefits in respect of financial services provided by the parties. Fidante is not an authorised deposit-taking institution (ADI) for the purpose of the Banking Act 1959 (Cth), and its obligations do not represent deposits or liabilities of an ADI in the Challenger Group (Challenger ADI) and no Challenger ADI provides a guarantee or otherwise provides assurance in respect of the obligations of Fidante. Investments in the Fund(s) are subject to investment risk, including possible delays in repayment and loss of income or principal invested. Accordingly, the performance, the repayment of capital or any particular rate of return on your investments are not guaranteed by any member of the Challenger Group.