
The case for an ‘ex-resources’ bias in Australian small-caps
Summary
- In the Australian equity market, the resources sector is characterised by (1) a constant cycle of ‘boom-and-bust’, (2) higher volatility, and (3) significant difficulty in forecasting earnings and hence valuing companies, due to the influence of global commodity prices. These issues are amplified for the small-cap sector given its higher exposure to resource companies than the large-cap sector.
- By contrast, the industrials sector – defined as all companies not classified as resource firms – offers small-cap investors a smoother investment journey, with the Small Industrials index delivering consistently lower volatility and better risk-adjusted returns than the Small Resources index since the indices were incepted in December 2001.
- Lennox Capital Partners invests with an ex-resources bias, through a focus on identifying companies with forecastable, sustainable earnings. Since inception in April 2017, the Lennox Australian Small Companies Fund has produced higher risk-adjusted returns than both the Small Industrials index and Small Resources index.
In the late 1960s, with global nickel prices soaring over supply concerns and a Canadian miners’ strike, a small Australian mining exploration firm, Poseidon NL, announced a significant discovery of the metal in Western Australia. While shares in the firm initially rose on these fundamentals, widespread speculative activity based on high nickel price assumptions drove the company’s share price from $0.80 in September 1969 to an intraday high of $280 less than 6 months later in February 1970. At its peak, Poseidon had a market capitalisation one-third that of BHP, despite it developing only a single mining lease. But when the Canadian strike ended and supply re-entered the market causing nickel prices to moderate, Poseidon would quickly lose three quarters of its value over the next 3 months alone. Despite producing nickel from 1974, the company was unable to generate sufficient profits and was delisted in 19761.
The ‘Poseidon bubble’, as this event later became known, is an extreme case, but it illustrates several important characteristics of the resource sector in the Australian equity market: the constant cycle of ‘boom-and-bust’, the higher return volatility this generates, and, perhaps most importantly, the fact that resource company values are as dependent on global commodity prices as they are on underlying operating performance, which adds significant difficulty to forecasting earnings and hence accurately valuing companies.
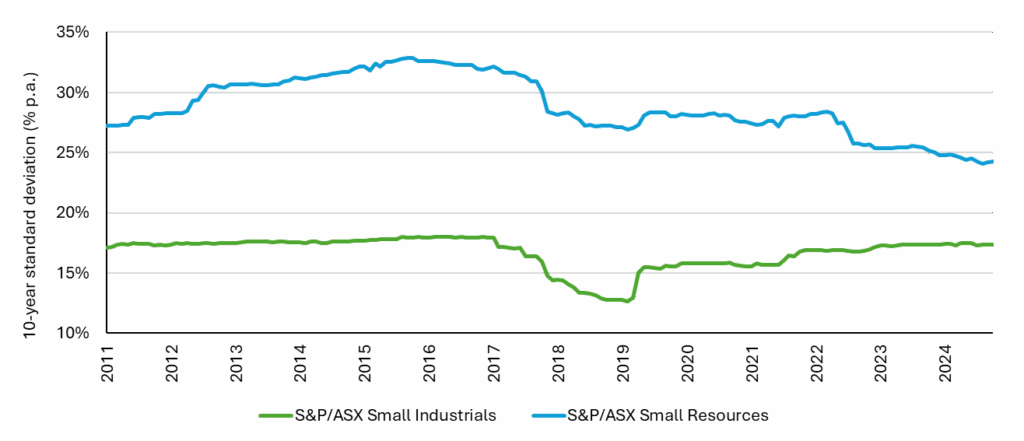
These issues are particularly acute for small-cap investors because of the higher exposure of the asset class to resource firms; as at 30 September 2025, the S&P/ASX Small Ordinaries Index had a 29.7% exposure to resources, compared to 21.4% for the large-cap S&P/ ASX 100 Index. Investors can observe that the above characteristics of resource companies remain true of small-caps – while both the S&P/ASX Small Resources Index and S&P/ASX Small Industrials Index2 have provided similar returns since both indices were incepted in December 2001 (7.7% p.a. to 6.7% p.a., respectively), the significant volatility of the late 2000s mining boom-and-bust in equity markets (Chart 1) has resulted in the Small Resources index recording consistently higher 10-year volatility than the Small Industrials index over the same period (Chart 2).
Chart 1: Relative performance of the S&P/ASX Small Resources Index, versus the S&P/ASX Small Industrials Index, from inception in December 2001 to September 2025
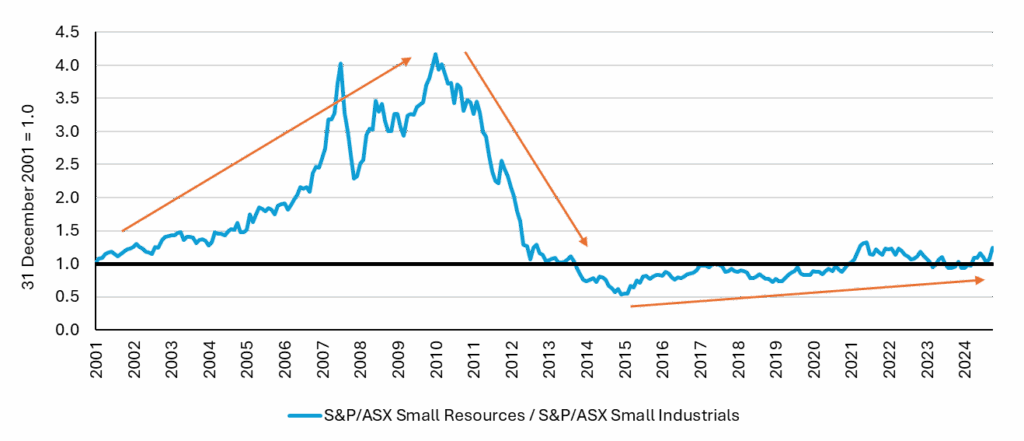
Chart 2: Monthly-rolling 10-year standard deviation of the S&P/ASX Small Resources Index and S&P/ASX Small Industrials Index, December 2011 to September 2025
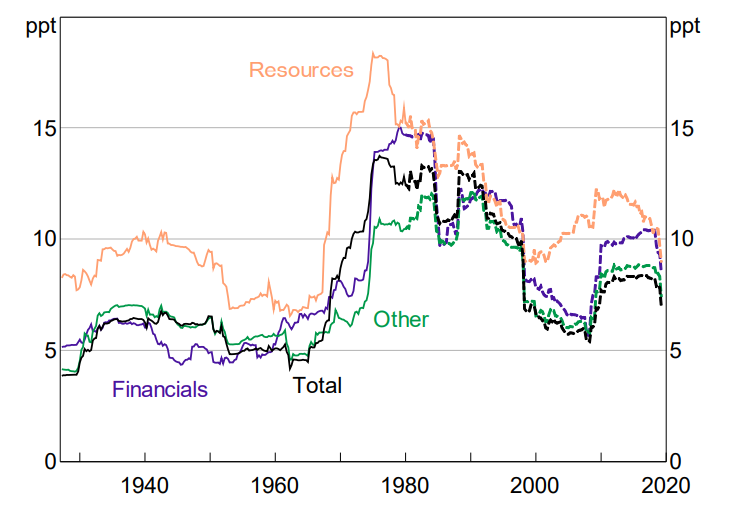
Longer-term empirical evidence also suggests that volatility is structurally higher for resources. A study
by the Reserve Bank of Australia looking at more than a century of returns from 1917 to 2019 concluded that the consistently higher volatility of the resources sector “is not just attributable to the individual booms and busts … but appears to have been a structural feature of the stocks for at least the past 100 years”3 (Chart 3). Importantly, the study also noted that “it does not appear to be the case that investors …were compensated for this extra volatility”4 over the period, with the ‘Resources’ sector producing a lower Sharpe ratio across the dataset than either the ‘Financials’ or ‘Other’ categories.
Chart 3: 10-year standard deviation of quarterly returns by sector, March 1917 to June 2019
A smoother investment journey
While resource stocks may outperform industrials over select periods, over the long-run they have produced
very similar returns to industrials – and adjusted for their additional, structural volatility, resources have historically underperformed industrials on a risk-adjusted basis. This suggests that tilting a small-cap exposure away from resources may result in a ‘smoother’ overall investment experience.
Finally, such a tilt also offers an advantage in disentangling the stock selection skill of active managers from wider macroeconomic conditions. The foundation of active management is the identification of market mispricing, and by removing the considerable influence of global commodity prices from the process of forecasting company earnings, industrials-focused managers face a clearer test of their ability to deliver alpha to investors through stock selection.
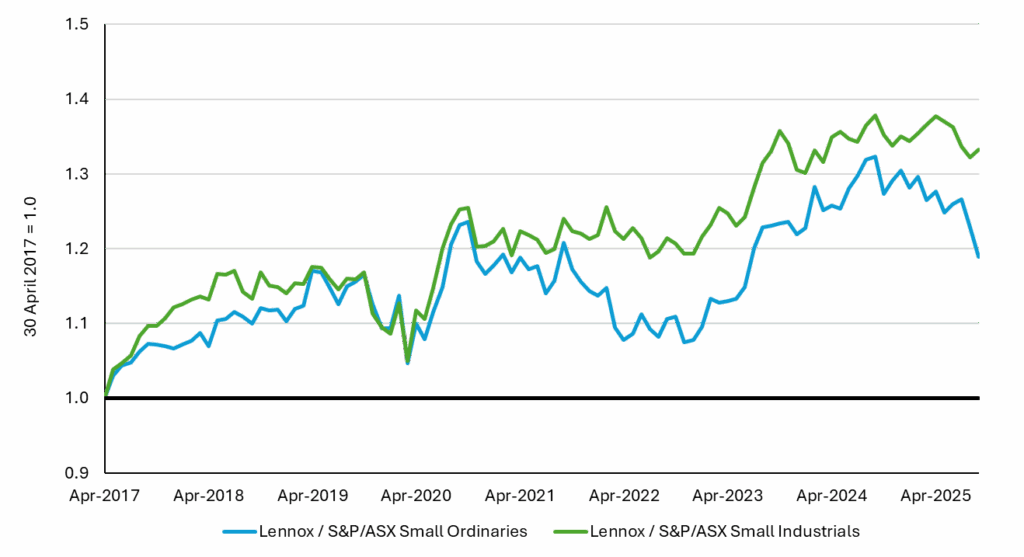
As part of its focus on company quality, for example, Lennox Capital Partners seeks to identify companies with sustainable earnings that can be confidently forecast, resulting in an ex-resources bias. As illustrated in Chart 4, Lennox’s strong track record in selecting the ‘hidden gems’ of small-cap industrials has seen the Lennox Australian Small Companies Fund deliver an excess return of +2.2% p.a., net of fees, over its benchmark S&P/ASX Small Ordinaries Accumulation Index, as well as an excess return of +3.7% p.a., net of fees, over the S&P/ASX Small Industrials Accumulation Index (both as at 30 September 2025). Additionally, the Fund has delivered better risk-adjusted returns than both the Small Industrials and Small Resources indices, as measured by Sharpe ratios, over the same period.
Chart 4: Cumulative outperformance of the Fund versus S&P/ASX Small Ordinaries Index and S&P/ASX Small Industrials Index since inception, April 2017 to September 2025
1Simon, J. (2003). ‘Three Australian asset-price bubbles’, Reserve Bank of Australia.
2S&P defines ‘resources’ as companies classified in the Energy sector (GICS Tier 1) and the Metals & Mining industry (GICS Tier 3), and all other companies as ‘industrials’, with the latter unrelated
to the GICS Industrials sector.
3Mathews, T. (2019), ‘A history of Australian equities’, Reserve Bank of Australia.
4Ibid.
Disclaimer:
This material has been prepared by Lennox Capital Partners Pty Limited (ABN 19 617 001 966) (AFSL 498737) (Lennox), the investment manager of Lennox Australian Small Companies Fund (Fund).
Fidante Partners Limited ABN 94 002 835 592 AFSL 234668 (Fidante) is a member of the Challenger Limited group of companies (Challenger Group) and is the responsible entity of the Fund. Other than information which is identified as sourced from Fidante in relation to the Fund, Fidante is not responsible for the information in this material, including any statements of opinion.
It is general information only and is not intended to provide you with financial advice or take into account your objectives, financial situation or needs. You should consider, with a financial adviser, whether the information is suitable to your circumstances. The Fund’s Target Market Determination and Product Disclosure Statement (PDS) available at www.fidante.com should be considered before making a decision about whether to buy or hold units in the Fund. To the extent permitted by law, no liability is accepted for any loss or damage as a result of any reliance on this information.
Past performance is not a reliable indicator of future performance.
Any projections are based on assumptions which we believe are reasonable but are subject to change and should not be relied upon.
Lennox and Fidante have entered into arrangements in connection with the distribution and administration of financial products to which this material relates. In connection with those arrangements, Lennox and Fidante may receive remuneration or other benefits in respect of financial services provided by the parties.
Investments in the Fund are subject to investment risk, including possible delays in repayment and loss of income or principal invested. Accordingly, the performance, the repayment of capital or any particular rate of return on your investments are not guaranteed by any member of the Challenger Group.