
Successful small cap investing: Part 1 – it pays to invert
The listed Australian small companies’ market is known for its significant capital growth, wealth creation and most importantly the fostering of innovative emerging businesses. It is the birthplace of many of Australia’s largest companies including names such as Realestate.com, Flight Centre and TPG Telecom.
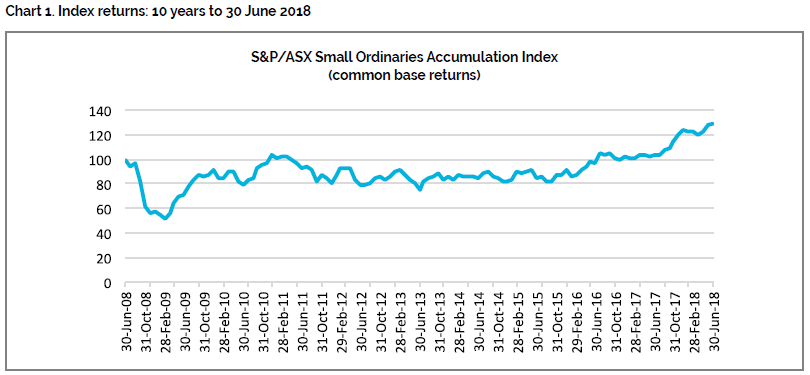
However, small cap market index returns over recent years have not correlated with this high growth reputation. Over the decade from 30 June 2008 the S&P/ASX Small Ordinaries Accumulation Index has returned an underwhelming 2.6% p.a. Taking in to account the inherent volatility associated with smaller companies, many investors wonder why such a promising, growth-oriented asset class has consistently under-delivered.
Using the S&P/ASX Small Ordinaries Index (“the Index”) as a proxy for the small cap market and data from the last 10 years (1 July 2008 to 30 June 2018), we have divided small cap companies’ performance into 3 distinct zones: Green (outperformance), Grey (neutral performance) and Red (underperformance). Most investors believe successful small cap active fund managers achieve success by solely concentrating on selecting companies in the Green Zone, or those companies that will outperform the market. As Charlie Munger has said “Invert, always invert: Turn a situation or problem upside down. Look at it backward.” Our thesis is that active small cap investors add the most value by inverting the problem. Rather than asking themselves, “how can I invest to make money” they should ask themselves, “how can I avoid those stocks in the Red Zone”. Not only does this way of thinking preserve investors’ capital but it also is the biggest contributor to outperforming the Index.
At Lennox, our research suggests that stocks in the Red Zone have significant deficiencies in one or more of the following areas: management; ESG; earnings quality; and/or the industry. A large part of our investment process involves screening out those companies that present red flags in one or more of these areas, thereby avoiding those stocks most likely to be in the Red Zone. We will go into more detail in each of the four factors in Parts 2 and 3 of “Successful small cap investing”.
Breaking down the small cap market
Chart 2 displays the return of all stocks contributing to the Index throughout the discussed time period. The Index holds around 200 stocks at any point in time, however its constituents change and are reweighted at periodic rebalances. In total, 571 stocks have contributed to the Index return over the 10 year period of our analysis.
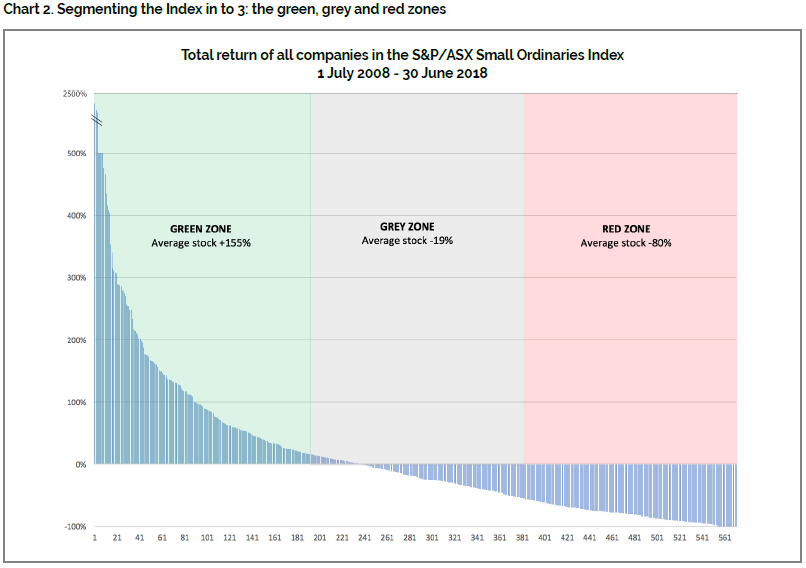
We have split the index in to three equal segments by number of stocks. The colour-coded groupings in the above chart are summarised as follows:
- The Green Zone: these gems have averaged a total return of over 155% each through the period of our analysis. They include companies like software developer Altium, travel company Corporate Travel, and infant formula business A2 Milk.
- The Grey Zone: stocks in this segment are companies that provided marginal positive and negative total share price returns and have therefore not contributed materially to the index.
- The Red Zone: stocks in the Red Zone have resulted in significant capital destruction for unfortunate investors, averaging a total loss of over 80% each. Notable investment disasters in this space include businesses such as retailer Dick Smith, sandalwood producer Quintis and television broadcaster Channel Ten.
Historically, a passive or index tracking investment in the small cap market would have consisted of one-third of investments that significantly appreciated in value (an average return of +155% each), one-third that were broadly neutral, and the final third that destroyed investors’ capital (an average return of -80% each). On a net basis, this investment would have returned little to investors.
The benefit of avoiding the Red Zone
The most common misconception of active small cap investors is that the best way to improve returns is to focus all their time and effort on identifying Green Zone stocks. Although investing in Green Zone stocks provide strong returns, avoiding stocks that land in the Red Zone produces similar outperformance.
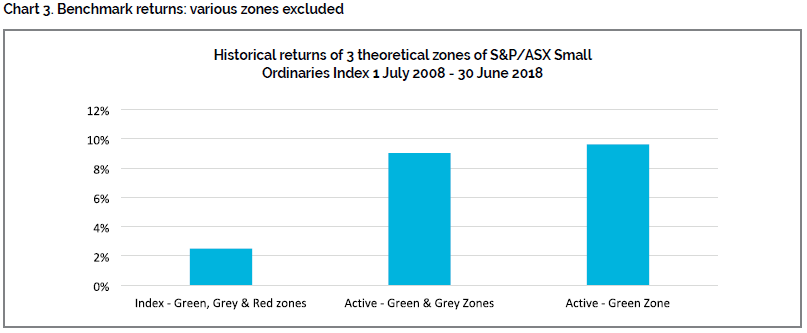
As a theoretical example: if we start with Index returns as a base, by purely avoiding all Red Zone stocks an active portfolio would have returned 9.0% p.a. through the period of our analysis – outperforming the Index by 6.4% p.a. If we were to only include stocks in the Green Zone, the incremental return is marginal at best, returning 9.6% p.a. Chart 3 below displays these different returns.
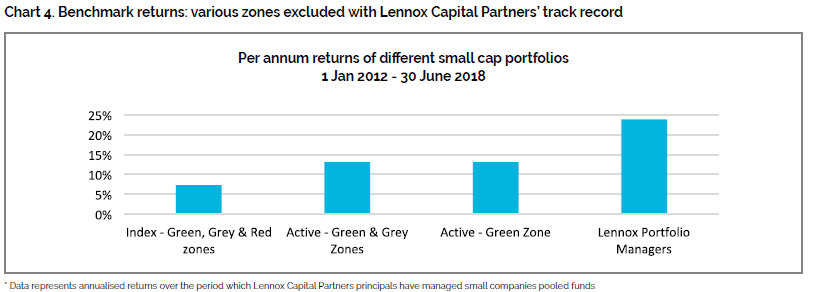
If we shorten the time horizon to match the track record of Lennox Capital Partners’ founders / portfolio managers, being from 1 January 2012 to 30 June 2018, we find the exact same phenomenon. Over 6.5 years the Index consisted of 439 companies with Green Zone stocks (the top third) returning an average of 159%, Grey Zone stocks (the middle third) returning an average of -3% and Red Zone stocks (the bottom third) returning an average of -72%.
Applying the same theoretical analysis to the Index, the performance produces the results in the following chart. Again, we find there is minimal improvement by holding a portfolio of only Green Zone stocks versus a portfolio of Green and Grey Zone stocks.
How to avoid stocks in the Red Zone
The obvious question for an active investor is if a common set of characteristics could be used to screen out companies in the Red Zone.
At Lennox we have researched these poor performing companies and discovered that the vast majority of stocks that have landed in the Red Zone have a significant deficiency in one or more of four key qualities of a business:
- Management: poor or incompetent management is by far the most destructive force to shareholder value. The ability to grow sales, manage costs and allocate capital effectively for return is no easy task, nor is the ability to identify people that have these skills sets.
- ESG: business models with negative environmental and social consequences are susceptible to regulatory change. Without a crystal ball it is very difficult for an investor to know when or if that earnings destructive regulatory change will occur, so it is best avoided altogether. Additionally, poor governance makes it very difficult for often neglected minority shareholders to benefit from the business’ success.
- Earnings Quality: there are many definitions of earnings within the listed market, though an investor should always ask themselves “are earnings real (cash backed) and are they sustainable”? If the market realises that earnings aren’t real or sustainable there is very little chance to save your investment.
- Industry: operating within a structurally challenged industry or holding a weak position within any industry means whatever earnings growth is being enjoyed will only prove temporary.
In parts 2 and 3 of this series we will explore in more detail the four factors that determine a small company’s quality score and how best to identify any structural weaknesses that will impact on shareholder returns.
Conclusion – Understanding the small cap market
Historical small companies index returns have underwhelmed, however dismissing the asset class would be a mistake. Returns within the small companies market have been diluted by poorly performing companies as opposed to a lack of earnings or growth potential within the cohort. With an understanding of the market dynamics and factors that drove these subdued returns, investors can exploit this knowledge for gain.
The reality of avoiding the Red Zone may be more difficult than our theory would suggest and arguably a 100% strike rate is unachievable. However, an active fund manager’s job is not just about only researching and selecting outperforming stocks. Having a disciplined and structured approach to identify potential Red Zone stocks should serve a small cap active investor well over the long run.
The information in this article has been prepared by Lennox Capital Partners Pty Ltd (“Lennox) (ABN 19617001966, AFSL 498737), on the basis that the Client is a wholesale client within the meaning of the Corporations Act 2001 (Cth), is general in nature and is not intended to constitute advice or a securities recommendation. It should be regarded as general information only rather than advice. Because of that, the Client should, before acting on any such information, consider its appropriateness, having regard to the Client’s objectives, financial situation and needs. Any information provided or conclusions made in this article, whether express or implied, including the case studies, do not take into account the investment objectives, financial situation and particular needs of the Client. Past performance is not a guide to future performance. Neither Lennox, Fidante Partners Limited (“FPL”)(ABN 94 002 835 592, AFSL 234668) nor any other person guarantees the repayment of capital or any particular rate of return of the Client portfolio. Except to the extent prohibited by statute, neither Lennox nor FPL nor any of their directors, officers, employees or agents accepts any liability (whether in negligence or otherwise) for any errors or omissions contained in this article.